60 Thoughts about 30 Teams
This is Part 2, of 2. Part 1 can be found here: http://tradingbases.squarespace.com/blog/2012/8/30/60-thoughts-about-30-teams-part-1-national-league.html
(Note: This was largely written Friday and Saturday. All statistics are through Friday night’s games.)
AL Central
Detroit Tigers: 1) Here is a look at the skills resume Detroit’s best pitcher posted last season: K rate: 25.8%. Walk rate: 5.9%, Ground Ball rate: 40.2%, Avg. Fast ball velocity: 95.0. Here is the resume for their best pitcher in 2012: K rate: 29.6%, Walk rate: 8.2%, Ground ball rate: 37.9%, Avg. Fastball velocity: 94.1. Pretty similar, no? In fact a regression on those variables reveals that 2011’s season was a bit better yielding an expected ERA of 2.99 compared to this year’s expected ERA of 3.02. (Hat tip to Matt Swartz, creator of SIERA.) As you’ve probably figured out, the 2011 season resulted in Cy Young and MVP Awards for Justin Verlander accompanied by a 2.40 ERA and 24 wins. The 2012 season won’t garner any hardware as it’s resulted in a 4.13 ERA and a respectable, but not eye-opening, 14 wins to date. Conclusion: Defensive support plays a huge role in the results-oriented statistics that decide baseball’s year-end awards.
2) Defensive support also plays a huge role in fame, recognition, and baseball fan Q-ratings. The statistics for the Tigers’ best pitcher in 2012 are not Justin Verlander’s, but Max Scherzer’s.
Chicago White Sox: 1) If there is an archive item to counterbalance my San Diego Padres foolishness, it will probably be my preview for the Chicago White Sox. I suspected all the ingredients were in place, in both Chicago and Detroit, for the White Sox to challenge the Tigers for the division crown right down to the final week of the season. However, like a master chef who knew something was missing, GM Kenny Williams went to the market and added a splash of Mediterranean spice in the form of The Greek God of Walks, Kevin Youkilis. Those extra 30 runs Youkilis is going to add, on the margin, to Chicago’s offense over the nearly 100 games he plays on the South Side is enough to push Chicago from just finishing behind, to just beating the Tigers for the AL Central crown.
2) Here is an excerpt from my book: “It’s pointless to construct a list of MLB’s unbearable announcers but I will add this: After listening to a number of White Sox broadcasts this year, I now understand why everyone I meet from Chicago is a Cubs fan.”
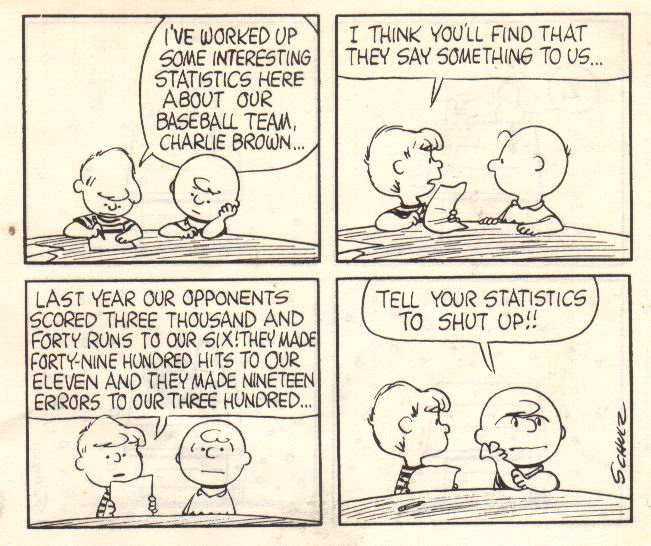
Kansas City Royals: 1) Probably the most fascinating statistic I uncovered culling through defensive data last winter was how much of an impact outfield assists have in masking a team’s pitching or fielding weaknesses. Even more fascinating was how random teams’ performance in that category appeared to be year-to-year. For the most part 2012 bears that out. To wit: The Phillies, despite an above-average defense, were last in the majors in 2011 with 15 outfield assists. They’ve already had 29 this year, 2nd in the majors despite a vastly inferior defense overall. San Francisco is one assist from the bottom of this year’s rankings; the Giants were 3rd last year. Plus, the Giants added Melky Cabrera who was part of Kansas City’s incredible 51-assist outfield in 2011. No other team in the last few years has come close to 51 outfield assists. So who leads the majors in outfield assists this year? The Kansas City Royals with 36 – 24% more than any other team and on a pace for 45. Like Charlie Brown to Schroeder, the Royals are telling my statistics to shut up. http://assets.sbnation.com/assets/338095/ShutUpWithStats.JPG
2) Here’s the absurdity of any team that gets aggressive on the base paths against the Royals. Kansas City’s pitching staff walks batters at the third highest rate in the American League. Despite its outfield’s ability to throw out base runners, Kansas City is the second worst team in the American League at turning a batted ball into an out. The worst? The Tigers – see my point above about defensive support. However, the Tigers staff is much better (2nd in the league in terms of rate) at striking batters out. Think about that combination. Batters put the ball in play at a high rate and the defense is bad. Not surprisingly then, at the end of Q3 of the baseball season, an American League batter had a better chance of getting on base versus the Royals than any other team! So why would a team ever risk making an out on the base paths against the Royals? There’s a reason Deion Sanders and Darrelle Revis have very low career interception totals. Football players may be required to undergo rigorous neurological examinations before reentering the field of play after a head injury, but I swear sometimes I think its baseball players and managers who need their heads examined.
Minnesota Twins: 1) The Twins have a much better offense than people – and when I say people here, I mean baseball handicappers – realize. In Q2 and Q3 (that’s 81 games or half a season) they scored 386 runs. That’s more than the Tigers who are perceived as a much more potent offensive team. It’s only 2 less than Texas, the highest scoring team in the AL and it’s 11 more than Boston the 2nd highest scoring team in the league.
2) The offense might be under-appreciated but Minnesota is still a .400 team because its starting pitching is the worst in baseball. They strike out an abysmal 15.2% of batters they face. Cleveland has the second worst rate at 17.2%. How incredibly bad, on a relative basis, does that make the Twins staff? Cleveland, at 29th, is closer in performance to the 17th team in the league, than the Twins, at 30th are to the Indians.
Cleveland Indians: 1) For the 2nd year in a row, the Indians spent the first-third of the season in first place only to self-destruct. This year’s version was far worse. On June 23 the Indians were in first place. Since then they won 27 and lost 54 and dropped to fourth place in the AL Central, 5 games behind the Royals who they were 7 games in front of a little more than two months ago.
2) Like the Twins, the cause for Cleveland’s poor performance is the starting rotation. Not only are the second worst at striking batters out, they’re fourth worst at walking them so that means a lot of balls being hit into the field of play with a lot of extra base runners on the bases when it happens. That’s a surefire way to give up a lot of runs and no American League team has given up more. That’s not bad luck, nor poor sequencing of events, it’s simply a lack of talent on the mound.
AL West
Texas Rangers: 1) Due to a number of factors (players coming off of career-years, the aging curves as well as injury histories of many of its offensive stalwarts, and an underwhelming rotation) I didn’t think the Rangers would be near as dominant in 2012 as 2011. In fact, once I factored in the improved Angels, I didn’t think the Rangers would win the division. I took some heat for this call while interviewed on a podcast and unlike some of my numbers-based arguments, it’s harder to get people to accept the invisible effects of aging. That call looked very silly one-quarter of the way into the season. In fact, looking at the standings you might think it looks silly now. The Rangers have the best record in the American League. However, look closer. They outscored their opponents by just 3 runs in Q2 and by 6 runs in Q3. They scored 19 less runs in Q2 than Q1 and 22 less runs in Q3 than Q2. If this were a stock chart, you’d be worried.
2) Does anyone else find it strange, that the two-time defending AL pennant winners willingly start the Cubs Opening Day battery every 5th day when Ryan Dempster takes the mound? It’s a strange site because Geovany Soto hasn’t done anything to make Rangers fans forget back-up Yorvit Torrealba let alone World Series MVP-candidate Mike Napoli.
Oakland A’s: 1) “What is happening in Oakland?!?!?” -- Radio Announcer, Moneyball
Here are the A’s runs scored by quarter in 2012 – Q1: 144. Q2: 162. Q3: 186. They are on a pace to score more than 200 runs in Q4 – and that sentence was written before they scored 20 runs against Boston on Friday night. Like I mentioned in the Pittsburgh section of yesterday’s note, I don’t normally advocate tossing out in-season data, but ignoring the Athletics first quarter offensive output is supported by very strong logic – it’s nearly an entirely different team. Only four of the Opening Day starters were in last night’s lineup.
The A’s have outplayed the Rangers since Q1 ended, I think they’ll outplay them the rest of the way and instead of just having their sights on a Wild Card berth, the A’s have a real chance to win the division. In fact, let’s say this: Despite never leading the division at any point during the first 161 games of the year, the A’s will beat the Rangers on October 3, in Oakland, to take the AL West crown.
2) I’m always on the lookout for unsustainable, non-repeatable performance. The one nagging concern I have about Oakland is that the pitching staff isn’t nearly as good as the results even after I factor in things like the ballpark effect of The Coliseum. After all, good defense is repeatable and tailoring your talent to the environment they play one-half of their games is simply good utilization of assets. Still, it’s really hard to explain this: All baseball fans know how important double plays are. They erase a prior weakness (allowing a runner on base) and occur in a situation where run expectancy was increasing and then immediately plummets after the double play. We also generally accept that “clutch” is a myth. Players can’t tailor their output only to important situations. This is the entire premise behind my frequent writings on “cluster luck”. That’s the set-up. Here’s the punch line: The A’s pitchers induce less ground balls then any staff in the majors. (This is what I meant by tailoring skills to an environment. Fly balls turn into home runs with less frequency in Oakland than just about any other big-league ball park.) Despite the lack of groundballs, the A’s ranked in the top-quartile of teams in groundball double plays, by opportunity, at the end of Q3. That’s an amazing “ability” to induce groundballs precisely when they are most needed, by pitchers who otherwise have less of an ability to induce groundballs than any other team in the majors. Related stat: The A’s have given up 114 home runs. 76, or 66.7% have occurred with the bases empty. (League average is 57.1%.) I think the A’s will be playing October baseball but if they don’t it’s probably because these two data points, somewhat related, reversed.
Los Angeles Angels: 1) Here is why the Angels aren’t going to make the playoffs: Despite the incredible excitement generated by probable double Rookie of the Year/Most Valuable Player winner Mike Trout, and despite an offense that looks as fearsome as any team in baseball, the Angels pitching staff gives up too many runs. To wit: In Q3 with every member of the lineup performing at a high level, the Angels scored 210 runs. However, the pitching staff gave up a whopping 227 runs. Only Cleveland has had a worse quarter pitching this year in the American League.
2) The Angels had their chance to gain ground but squandered it. They will still win more games than they lose the rest of the way, but it looks like the distance and the traffic to the second wild card spot will be too much to overcome unless the pitchers strike out more batters (they’re currently 7th in the American League in strike out rate) walk fewer (currently 8th) and give up fewer homers (8th in ground ball rate). That’s a staff with middling skill sets even if they sport fantasy favorites like Dan Haren, Jered Weaver, and C.J. Wilson.
Seattle Mariners: 1) Like the A’s, the Mariners tailor their roster to the environment they play half of their games in. They have a pitch-to-contact staff of hurlers who induce ground balls at a league-low rate ex-Oakland. (The underwhelming skill sets of the pitching staff are especially evident when you exclude the elite skill set of Felix Hernandez.) They also emphasize defense and through Q3 they had the best defense in baseball. So why are they in last place with only a fleeting chance to finish at .500 for the season? The offense is terrible, last in the American League in scoring.
2) Ready for this? The offense is worse, much worse, than its runs scored reveals. The Mariners have been the top beneficiary of “cluster luck.” As I wrote in detail in many of the Spring Training previews a team’s on-base percentage, slugging percentage, and isolated power (slugging percentage minus batting average), determines how many hits a team should have for each run it scores. League average is right around 2.0 every year. The Mariners are on a pace to score 50 more runs by the end of the year than their batting results should yield. That’s cluster luck. For example, through Q3, the Cubs, Marlins, and Astros had all scored less, to materially less runs than the Mariners, despite posting better results in every offensive category listed above.
AL East
Baltimore Orioles: 1) Nothing I am going to write will be well received by Orioles fans. But they shouldn’t care. Baseball isn’t chess. The better player doesn’t always win. (As if I know anything about chess; I couldn’t beat, say, Ron Weasley in a game.) Like a Pete Carril-led Princeton basketball team, they’ve shortened the season to thirty games which means they have a legitimate chance to play October baseball, even if everything I look it tells me they are not even an average major league team in terms of skill sets.
2) In terms of numbers let’s look at the bullpen: Owing to the high-leverage situations they pitch in, combined with the fact that they often enter a game with men on base, it’s imperative for a successful bullpen to strike out batters at a high rate. The Orioles bullpen has a 3.06 ERA despite a strikeout rate that is next to last in the American League. That means a lot of balls are being hit into the field of play against a defense that is average at best – unless the bullpen is in the game. Then the defense suddenly is as good as the Rays or Mariners. Through Q3, the Orioles difference between “batting average on balls in play” when starters are in the game vs. relievers was the highest in baseball. It’s as if the Orioles fielders have learned how to play “clutch” defense. Even if you believe in clutch hitting, it’s just too absurd to even consider the idea that Mark Reynolds et al can raise their fielding standards just because the game is on the line. That’s my favorite example but there are a lot of little reasons Baltimore’s results don’t square with its talent-based output. Still, that doesn’t matter to the fans lining Eutaw Street for Boog’s BBQ this September. They should just enjoy the pleasure of a pennant race.
New York Yankees: 1) The Yankees must feel a little like Apollo Creed near the end of Rocky – absolutely astounded and perhaps disheartened that they are even in a battle for a playoff spot. Against roughly the same competition as the Orioles, the Yankees have scored 77 more runs and allowed 55 less. That’s a 132 run differential! And yet, the Yankees are 3 games ahead of the Orioles with thirty games left in the season.
2) Other first place team differentials: The Rangers are 125 runs better than the Mariners and 15 games ahead. Nationals are 133 better than the Phillies and 16.5 up in the standings. Finally, San Francisco is 131 runs better than Colorado and a whopping 20 games ahead of the Rockies.
Toronto Blue Jays: 1) Coinciding roughly with the injury to the best AL rookie not named Mike Trout, Brett Lawrie, the Blue Jays have fielded some extremely offensively challenged lineups. Thanks to overlapping injuries to Edward Encarnacion, Jose Bautista, and Adam Lind, and what seemed like the entire starting rotation, there have been a number of nights in July and August when the Blue Jays were fielding teams that would lose 100 games over the course of a full season. They are 17-29, 3rd worst in baseball, since the All-Star Break because of a lack of depth, not because of a lack of talent when the starters are healthy.
2) Injuries have been so bad for Toronto they have started at least four different people at every single position in the field except shortstop, where they’ve had three different starters. It’s even worse on the mound where eleven different pitchers have started at least two games.
Tampa Bay Rays: 1) There is going to be a very good team left out of the AL playoffs; two if the Orioles make the postseason. And that’s not including the Los Angeles Angels, an extremely potent offensive team who I wrote would be on the outside looking in. Obviously, since I’m a heartless observer of data, I’ve got the Orioles missing as well. I’ve got the A’s and Rangers both in. That leaves the Rays with the loser of the White Sox/Tigers battle for the AL Central crown competing for the last wild card spot. The Rays, with the best balance of pitching, hitting and defense, have the best shot at grabbing the final berth.
2) Once again, the Rays defense is tremendous – a huge competitive advantage versus their competition. The rotation has three front line studs (David Price, James Shields, and an emerging Matt Moore) and they have the best bullpen in the league in terms of results and skill sets. The Rays also have a sneaky-good offense – if everyone is healthy. Right now, they are. It’s imperative Matt Joyce and Evan Longoria remain in the lineup the rest of the season. If they do, the Rays have enough offense to blend with the pitching and defense to win 60% of their remaining games. That should be enough for them to join a very talented set of AL playoff squads.
Boston Red Sox: 1 and 2 and . . .) The most enduring, unflattering stereotype of baseball bloggers and other statistically-inclined analysts, is that they reside in their mother’s basement, often clad only in their boxers. The implication of that description is that they are unemployed. Of course, that drives many baseball bloggers nuts because while they are passionate about baseball, it’s just a hobby outside of their “real” jobs. And yet, when I see the general reaction to the Red Sox mess from many baseball writers, including those who are obviously employed by the publications they write for, I sometimes wonder if they remember that they actually do have jobs.
I think I’m broadly summing up the thoughts of many of these writers correctly when I state their consensus is that although the Red Sox are in 4th place, 10 games under .500 and have greatly underachieved spring training expectations, Red Sox manager Bobby Valentine can’t get hits with runners on base, he didn’t give up any leads when he came in from the bullpen, and he isn’t the one kicking the ball around the field on defense. As far as the late-July coup in which players surreptitiously met with ownership and aired their grievances in an effort to get Valentine fired, I think the feelings of many of those observers and countless fans were, “Grow up and perform on the field at a level equal to the millions of dollars you’re being paid.”
This is where I ask, “Don’t any of these writers have jobs?”
Despite varying accounts of some of the meeting details, what apparently is not in dispute is the way Bobby Valentine treats and communicates with his players, the line employees of the organization, if you will. Valentine knows two methods of communication: unapproachable distance and biting sarcasm. In other words, silence and rage – the two tools of intimidation common to every abusive parent, coach, and boss.
The methods of leadership used by Vince Lombardi, Billy Martin and Bobby Knight are as unacceptable in any workplace today as Roger Sterling going down to the steno pool to slap one of “the girls” in the ass as a way of inviting her to happy hour. Many of us reading this have been employees in huge accounting firms, investment banks, or consulting firms. In some ways, (zero-sum competition, similar ratios of manager to dozens of employees, much higher paid than average workers) those jobs have a lot in common with a baseball team. Many of us also know, unfortunately, how utterly toxic the work environment can be under abusive leadership.
I guess I’m different from many other baseball observers, especially those that are statistically-inclined when I say there is zero doubt in my mind Bobby Valentine adversely and materially affected the performance of the Red Sox on the field this year. Management however, starting with the Kevin Youkilis give-away in May, purged the team of every single person, with the exception of Dustin Pedroia, who had the nerve to say, we’re not taking this in our workplace.
This seriously makes me wonder if, like so many other financial professionals profiled in Nassim Nicholas Taleb’s The Black Swan and Fooled by Randomness, Red Sox owner John Henry is simply lucky to be rich. Because he certainly doesn’t seem smart enough to recognize what to do with a toxic manager in the workplace.
Mop Up Duty:
Joe Peta is the author of Trading Bases, the Newsletter, a companion piece to Trading Bases, A Story about Wall Street, Gambling, and Baseball* (*) Not necessarily in that order, a Dutton Books/Penguin (U.S.A.) March 7, 2013 release. The book is available for pre-order here: http://www.amazon.com/Trading-Bases-Gambling-Baseball-Necessarily/dp/0525953647/ref=sr_1_1?s=books&ie=UTF8&qid=1346604029&sr=1-1&keywords=trading+bases
If you have been forwarded this issue and would like to be placed on the mailing list, please send an e-mail to tradingbases@gmail.com
All newsletter archives are located at http://tradingbases.squarespace.com
You can follow me on Twitter here: @MagicRatSF
I will be updating progress on the path to publication on Facebook as well where I can be found here: http://www.facebook.com/#!/profile.php?id=1761681056
If you want to be taken off the e-mail list, please let me know at tradingbases@gmail.com